Whenever I have a customer complain about CPU usage, the first thing I check is the 'top' command. This is one of the closer commands to Windws' Process Explorer. This will easily show you which process is taking all the CPU Usage. Sometimes though, it isn't a specific process that is taking up the CPU, it's... something else.
Let's first take a look at the output of top:
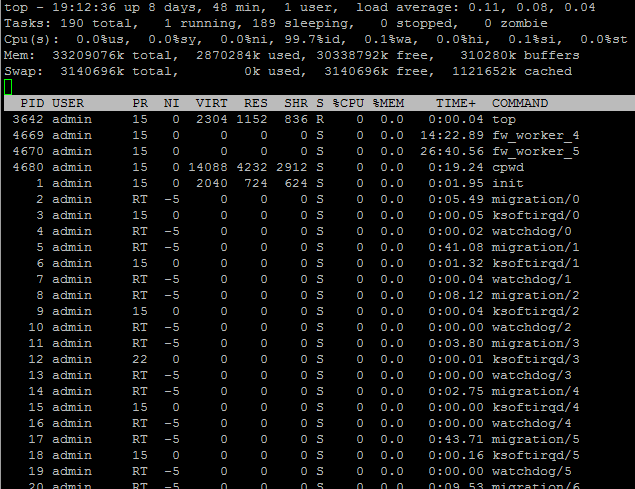
Here, we can see that 99.7% of the CPU is id. id is Idle. Sometimes, some of the other entries along that line are what's taking up the CPU. But what do they mean? Well, wonder no more, for this is the very thing this article is all about! Here's what they mean:
us: user cpu - Percentage of the CPU for user processes
sy: system cpu - Percentage of the CPU for system processes
ni: user nice - Percentage of the CPU processes with low priority through nice
id: idle cpu - Percentage of the CPU not used
wa: io wait - Percentage of the CPU processes waiting for I/O operations
hi: hardware irq - Percentage of the CPU serving hardware interrupts
si: software irq - Percentage of the CPU serving software interrupts
st: steal time - The amount of CPU ‘stolen’ from this virtual machine by the hypervisor for other tasks (such as running another virtual machine) this will be 0 on desktop and server without Virtual machine.
A few more details...
I have seen some high 'wa' on logging servers. In these situations, this usually indicates that there are just so many logs coming in the CPU is waiting on the disk to write more logs. If it just spikes on occasion, it is not likely to be anything to worry about, but if it is constantly high, your log server may be undersized to handle the amount of logs coming in.
On some firewalls/gateways, I have also seen some high 'si'. Again, spikes are not horrible, but constant high usage can indicate that too much traffic is coming in to the device, not necessarily all on the same interface. This would be all traffic on all interfaces. This also would not be the processing of traffic (firewall rules, deep packet inspection, etc...). This is literally sheer amount of traffic coming in. If this is constantly high, you would need to either redesign the network to relieve some of that load, or get a bigger/better device.
Let me know some of the wild things you've seen in a top output in the comments section.